
Get this book -> Problems on Array: For Interviews and Competitive Programming
In this article, we have presented 40 Interview questions on Data Science covering several topics including Multiple choice questions (MCQs) and Descriptive questions with answers.
Table of contents
- Multiple choice questions (MCQs)
- Descriptive questions
- Basic questions
- Analytical questions
Multiple choice questions (MCQs)
1. Which of the following is TRUE?
(a) correlation(X,Y) = (covariance(X) covariance(Y))/covariance(X,Y)
(b) correlation(X,Y) = covariance(X,Y)/(covariance(X) covariance(Y))
(c) covariance(X,Y) = correlation(X,Y)/(correlation(X) correlation(Y))
(d) covariance(X,Y) = (correlation(X) correlation(Y))/correlation(X,Y)
Ans: Option - b
Explanation: Correlation is dimensionless and units of covariance is obtained from multiplication of units of the two variables.
2. Which of these comes under the wrapper method of feature selection?
(a) Fisher’s Score method
(b) Variance Threshold
(c) Forward Selection
(d) None of these
Ans: Option - c
Explanation: Wrapper methods usually perform some greedy search method on feature set to assess their quality. In forward selection, one feature is tested, and new ones are added on it until a good fit is obtained.
3. Analyzing the age of a group of people comes under which type of analysis?
(a) Univariate analysis
(b) Bivariate analysis
(c) Multivariate analysis
(d) None of these
Ans: Option - a
Explanation: Since it contains only one variable: the age, it comes under univariate analysis.
4. Which of the following is a plot between true and false positive rates?
(a) Correlation matrix
(b) ROC curve
(c) There's no such plot
(d) None of these
Ans: Option - b
Explanation: The Receiver Operating Characteristic (ROC) is a plot between true and false positive rates.
5. Which of the following logic function cannot be implemented by a 2-input perceptron?
(a) AND
(b) OR
(c) NOR
(d) XOR
Ans: Option - d
Explanation: We need a non-linear decision boundary for XOR function, which is not given by a perceptron.
6. A robotic dog learning movements of his arms is an example of
(a) Supervised learning
(b) Unsupervised learning
(c) Reinforcement learning
(d) Both (a) and (b)
Ans: Option - c
Explanation: It is an example of reinforcement learning, as the robot is learning from its environment: getting rewards for positive action and penalties for negative ones.
7. Which of the following are properties of a normal distribution?
(a) Symmetrical
(b) Unimodal
(c) Mean, median and mode are located in the center
(d) All of these
Ans: Option - d
Explanation: For a curve to be a normal distribution curve, it has to be symmetric, have only one mode and mean, median and mode should be located in the central part.
8. When a sample obtained is not representative of the population intended to be analyzed, it is called
(a) Selection bias
(b) Survivorship bias
(c) Under coverage bias
(d) Recall bias
Ans: Option - a
Explanation: It is selection bias as proper randomization is not achieved, failing to represent the whole population to be analyzed.
9. What is 'Naive' in Naive Bayes theorem
(a) Just another word
(b) Denotes the assumption that each variable in dataset is independent of the other.
(c) Denotes the assumption that each variable in dataset is dependent of the other.
(d) None of these
Ans: Option - b
Explanation: It has the word 'naive' as it makes an assumption that each variable in dataset is independent of the other.
10. Combining several individual models together to improve the predictive power of model is called
(a) Ensemble learning
(b) Supervised learning
(c) Reinforcement learning
(d) Unsupervised learning
Ans: Option - a
Explanation: In Ensemble learning, many diverse models are combined together to give effective predictions for complex problem.
11.We want to predict the probability of death from heart disease based on three risk factors: age, gender, and blood cholesterol level. What is the most appropriate algorithm for this case?
(a) Linear Regression
(b) K-means clustering
(c) Logistic Regression
(d) Apriori algorithm
Ans: Option - c
Explanation: Logistic regression is the most suitable algorithm for the given problem as it models a binary outcome.
12.Which of the following is an example of time series problem?
   A.Estimating the total sales in next 3 years of an insurance company.
   B.Examining the relationship between the age and price for used cars sold in the last year by a car dealership company.
   C.Estimating the number of calls for the next one week.
(a) Both A and B
(b) Both A and C
(c) All the above
(d) Both B and C
Ans: Option - b
Explanation: In cases A and C we have a time component associated with the target variable. Where as in B, even though there is a time component, the relationship between two variables is established using regression as there is no predicting or forecasting.
13.What is data that has a column for each variable is called as?
(a) Column-wise data
(b) Row-wise data
(c) Long format data
(d) Wide format data
Ans: Option - d
Explanation: Wide data has a column for each variable.
14.The task of uncovering relationships among data is known as
(a) Association analysis
(b) Relationship analysis
(c) Sentiment analysis
(d) Risk analysis
Ans: Option - a
Explanation: The task of uncovering relationships among data is known as Association analysis. It is used to understand how data are connected with each other.
15.What is the method to convert date-strings to time series in a pandas series?
(a) pd.date()
(b) pd.time()
(c) pd.to_datetime()
(d) pd.datetime()
Ans: Option - c
Explanation: We will use the to_datetime() function in pandas library to convert date-strings to time series.
16.Select the correct order of steps in an LSTM network
   A.The network decides what part of the current state makes it to the output.
   B.The network decides what to forget and what to remember.
   C.It selectively updates cell state values.
(a) A,B,C
(b) B,A,C
(c) B,C,A
(d) C,B,A
Ans: Option - c
17.In neural networks, a parameter whose value is set before the learning process begins is known as
(a) Hypoparameter
(b) Hyperparameter
(c) Error parameter
(d) Model parameter
Ans: Option - c
Explanation: A parameter whose value is set before the learning process begins is known as Hyperparameter. It is used for controlling the learning process.
18.Which is more accurate for MNIST problem?
(a) Logistic regression
(b) K-means clustering
(c) Linear regression
(d) Multilayer perceptron
Ans: Option - d
Explanation: Multilayer perceptron has 96% accuracy for the MNIST problem.
19.Which constitutes the core components of a convolutional layer?
(a) Filter size
(b) Filter stride
(c) Filter number
(d) All the above
Ans: Option - d
Explanation: Filter size, stride and number are all components of a convolutional layer.
20.Which of the following activation function output is zero centered?
(a) Softmax
(b) Hyperbolic Tangent.
(c) Sigmoid
(d) Leaky ReLU
Ans: Option - b
Explanation: The tanh activation function is symmetric about zero. It has a range of [-1,1].
Descriptive Questions
Basic Questions
1. What is Data Science?
Data science is an interdisciplinary field of study that deals with extracting useful insights and informations from the data available by putting in use statistics, mathematics, programming and various algorithms. This is an extremely popular field now a days, as it enables us mine noisy, raw data and predict the performance of a business, product, likes and dislikes of consumer and also in fraud detection among its many other uses.
2. What do you understand by linear and logistic regression?
Linear regression is a supervised regression algorithm that is usually used for finding relationships between variables i.e predict values of a dependent variable based on values of one or more independent variables.
Logistic regression is a supervised classification algorithm which predicts the outcome of a dependent variable ( 1 or 0 ) with a given set of input data of either dependent or independent variables. It is used to calculate the probability of an event.
3. Outline the differences between supervised and unsupervised machine learning.
| Supervised Learning | Unsupervised Learning |
|---|---|
| The model is trained using labeled data as inputs | The model is trained using unlabeled data as inputs |
| It is computationally easier | It is computationally complex |
| Has a feedback mechanism | No feedback mechanism |
| Used for prediction and classification models | Used for extracting information from large amounts of data |
| Eg: Linear regression, Decision tree | Eg: K-means clustering, Apriori algorithm |
4. How can we handle missing data?
Before handling missing data in a column, we need to know the percentage of missing data in that column. If more than half rows in that column are empty, it is best to eliminate that column. If the percentage of missing data is low, then we can fill it up using several methods.
- One is to fill it up with the most frequent value of the column.
- Secondly, we can take the median or mean of all the values in that column and fill the empty rows with the calculated value.
- Finally, we can make use of library like Datawig to impute missing values.
5.What is A/B testing?
A/B testing is a controlled hypothesis testing for randomized variables. It is usually used to find the best design for a website based on the data about their activity. Two possible alternatives A and B are considered and the one with better efficacy is chosen.
6.Explain overfitting and underfitting.
Overfitting is when a machine learning model is too closely fit over a certain dataset and tries to go through more data points in the dataset than required and looses its ability to generalize and adapt over any given dataset to produce result.
Underfitting is when the model fails to catch the underlying trend in the dataset i.e when it fails to learn properly from the training data. This reduces the accuracy of the prediction.
7. What is a confusion matrix?
Confusion matrix is a table that defines the performance of a machine learning algorithm on test data for which the true output values are known beforehand. A few basic terms to know are:
- True Positives : Both the actual output and the output given by model are True.
- True Negatives : Both the actual output and the output given by model are False.
- False Positives :The actual output is False where as the output given by model is True.
- False Negatives :The actual output is True where as the output given by model is False.
8. What is p-value?
In hypothesis testing, p-value tells us whether to accept or reject the null hypothesis. It describes the probability of the data occurring under null hypothesis.
if p-value is:
- >0.5, we reject the null hypothesis
- <0.5, we accept the null hypothesis
- =0.5, the hypothesis could go either way
9. What are Eigenvalues and Eigenvectors?
Eigenvectors are unit vectors whose magnitude is 1 and are used for understanding linear transformations.
Eigenvalues are coefficients of Eigenvectors which gives different magnitudes to the vectors and expresses the direction along which a linear transformation takes place i.e stretching, flipping, compressing.
10. What is resampling?
Resampling is a method used to draw samples from a dataset to improve accuracy of the model and also obtain further information on some parameters. It is done to check the accuracy of the model, when it needs to be validated using random subsets or when substituting labels on data points.
Analytical questions
1.You are given a dataset on cancer detection. You have built a classification model and achieved an accuracy of 96 percent. Why shouldn't you be happy with your model performance? What can you do about it?
In the dataset on cancer detection, we come across the problem of imbalanced dataset as there is an uneven distribution of classes i.e the number of people who actually have cancer is way less than the number of people who do not have cancer. The 96% accuracy rate might be only predicting the majority class correctly. But our focus here should be the correct prediction of the minority class i.e people who actually have cancer. Therefore accuracy of the model cannot be considered as a measure of its performance.
Here, the sensitivity and specificity (True positive and True negative rates) must be considered to measure the performance of the model. The F1 score, which is the harmonic mean of precision and recall can also be used to determine the class-wise performance of the model.
2. What is CNN and what are the different layers in it?
CNN stands for Convolutional neural network. Similar to neural networks, it has neurons that can receive many inputs, takes the weighted sum of each neuron's input and passes it through an activation function. There is also a loss function associated to it at the end. CNN has 4 main layer. They are:
- Convolutional layer - This layer performs the convolution operation i.e different feature maps are convoluted over the dataset.
- ReLU layer - Rectified Linear Unit layer is an activation function layer that smoothens the inputs from convolutional layer by converting all negative pixels to 0.
- Pooling layer - This layer reduces the dimensionality of the stack of outputs from the activation layer.
- Fully connected layer - This layer predicts the image and classifies objects in it.
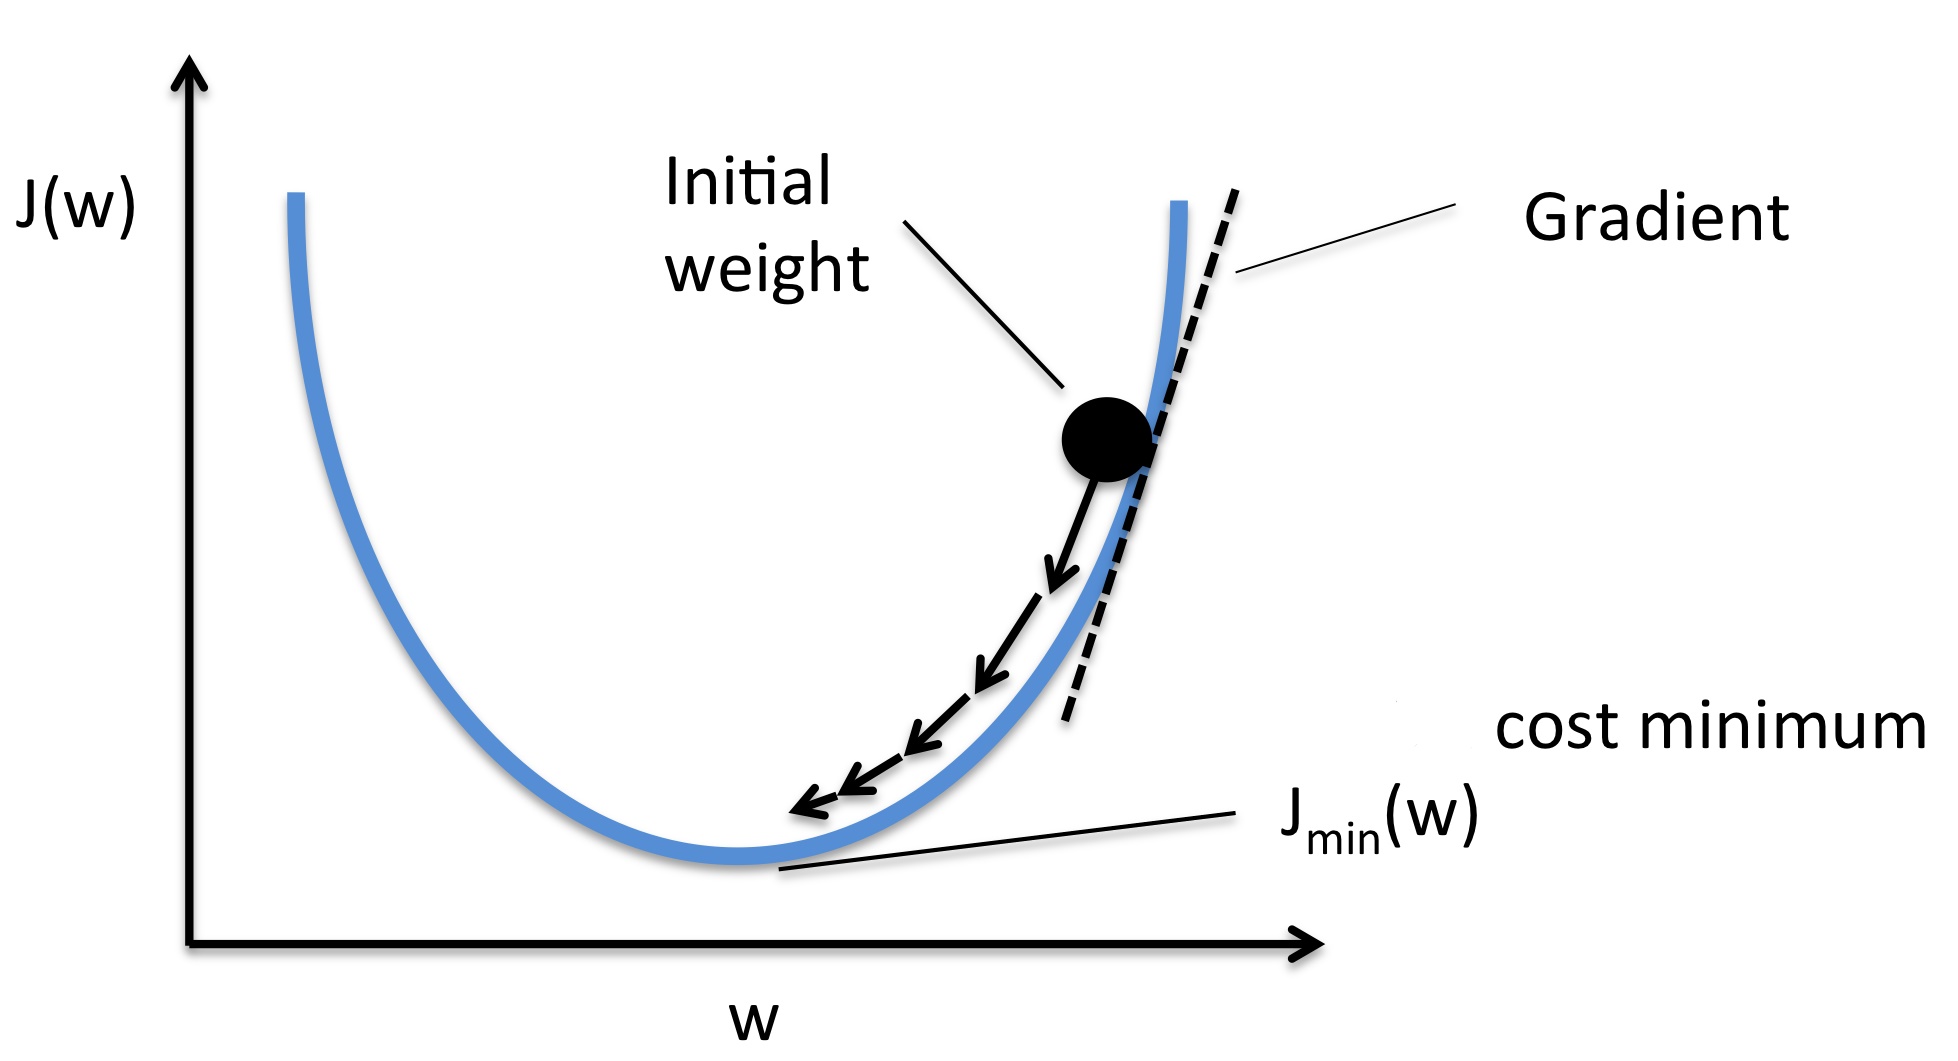
3. Explain Gradient descent.
A gradient can be thought of as the slope of a function. Basically, it measures the amount of change in the output function when the inputs are changed a little bit.
Gradient descent is an optimization algorithm used to find values of parameters of an activation function that minimizes the function. In layman's language, it can be understood by the following 4 steps:
- Pick a random point.
- Find its slope.
- Move towards the downhill direction.
- Repeat steps 2-3 until the minimum is reached.
Calculating gradient requires looking at every single data point.
4. How are the time series problems different from other regression problems?
Every time a problem contains a time variable, it is not necessarily a time series problem. For example, we have a housing dataset that contains the year in which the houses were built, area, locality and we are required to predict their prices. Even though the year here is a time variable, it is a regression problem.
For a problem to be a time series problem, we are looking into a target variable that changes with time. One more characteristic of a time series problem is that the the observations that are closer in time are similar than the observations that are distant in time span. For example, the the market trends of today and tomorrow might be similar. But the market trend 4 months ago won't be similar.
To summarize, time series problem is extrapolation whereas regression problem is interpolation.
5. Explain content-based and collaborative filtering in recommender systems.
Both collaborative and content based filtering are different methods to build a recommender system.
In content-based filtering, recommendations are given to users based on the properties of the content the user is interested in. For example, if a user purchases a certain art piece and gives it good ratings, it tells us that the user is interested in such art pieces. So if more such art pieces are recommended to the user, there is a higher chance of the user liking it and purchasing it.
In collaborative filtering, recommendations are given to users based on the likes and dislikes of other similar users. For example, If both User X and User Y are interested in home decors and User Y purchased and liked a decoration piece, it would be recommended to User X.
6.Why is data cleaning crucial?
Data cleaning is the process where all the data in the database is carefully examined and all the irrelevant, incomplete and duplicated data are removed and the problems in the data are fixed as dirty data may tamper the results.
Suppose a politician is standing for state elections and his council advises him to campaign on an agenda that clearly is not needed in that state at the moment but was of need centuries ago, he may loose his elections. That is why keeping up with new data and discarding new data is important and this is where data cleaning comes into play.
Cleaning data results in more accurate predictions. Cleaning data before running it in the model would result in increased speed and better performance of the model. It helps maintain consistency in data and also aids in identifying and fixing any structural issues in the data.
7. Write a SQL query that identifies cities with higher than average home prices when compared to the national average. Output the city names.
Hint: Use table zillow_transactions
SELECT city
FROM zillow_transactions a
GROUP BY city
HAVING avg(a.mkt_price) >
  (SELECT avg(mkt_price)
   FROM zillow_transactions)
ORDER BY city ASC
We use the HAVING clause in the above solution whose inner query calculates the average market price using the avg(); the column mkt_price is selected from the table and averaged for the purpose of comparison.
8. What is the difference between a bar graph and a histogram?
| Bar graph | Histogram |
|---|---|
| It is a categorical plot. | It is a distribution plot. |
| Height of the bin represents the size of that particular category. | Height of the bin represents the frequency of observation. |
| Each column represents a group defined by a categorical variable. | Each column represents a group defined by a quantitative variable. |
| Elements are taken as individual entities. | Elements are grouped together, so that they are considered as ranges. |
| There are spaces between bins | Generally no spacing is there between bins. |
| Bins can be reordered. | Bins cannot be reordered. |
9. What is lambda function? Explain the working of map, reduce and filter functions in python.
Lambda function is a function in python that has no name at the time of defining it. They are also known as anonymous functions. When we need to define a short function that is of a single line, instead of defining a function traditionally, we use the lambda function to reduce the number of lines of code.
The map() function applies the function to all elements of the input list.
Syntax:
map(function_to_apply, list_of_inputs)
The filter() function returns a list of elements for which the function holds true based on the condition given.
Syntax:
filter(function, sequence)
The reduce() function performs the same operation on sequential pairs of items in a list. It uses the result of first operation as one of the parameters in the second operation.
Syntax:
reduce(function, sequence)
10. Consider a case where you know the probability of finding at least one shooting star in a 15-minute interval is 30%. Evaluate the probability of finding at least one shooting star in a one-hour duration?
We know that,
Probability of finding atleast 1 shooting star in 15 min = P(finding in 15min) = 30% = 0.3
Hence, Probability of not sighting any
shooting star in 15 min = 1-P(finding in 15min)
= 1-0.3
= 0.7
Probability of not finding shooting star in 1 hour
= 0.7^4
= 0.1372
Probability of finding atleast 1
shooting star in 1 hour = 1-0.1372
= 0.8628
= 86.28%
With this article at OpenGenus, you must have a good practice with Interview questions on Data Science.